TWDB Home > Water Planning > Planning Data > Socioeconomic Impact Analysis
Socioeconomic Impact Analysis
Insufficient water supplies would negatively impact not only existing businesses and industry, but also ongoing economic development efforts in Texas. An unreliable water supply also disrupts activity in homes, schools, and government and endangers public health and safety. For these reasons, planning groups are required to evaluate the social and economic impacts of not meeting the identified water needs in their regional water plans.
The TWDB assists the Regional Water Planning Groups in evaluating the social and economic impacts of not meeting identified water needs for a single year drought of record. All impact estimates are in year 2018 dollars and were calculated using a variety of data sources and tools, including the use of a region-specific IMPLAN (Impact for Planning Analysis) model. The dashboards below display water demands and needs, as well as potential social and economic impacts of not meeting water needs in their 2021 Regional Water Plans (RWP).
Socioeconomic Dashboards User GuideSocioeconomic Impact Analysis by Regional Water Planning Group
Socioeconomic Impact Analysis by Region and County
To use the interactive dashboard, select a Regional Water Planning Group from the drop-down menu. Click on the button that will appear to view County-level data. Then click the back arrow to return to the regional data. Use the drop-down to view data by Water Use Category (irrigation, livestock, manufacturing, mining, municipal, and steam-electric power).
Note: projected socioeconomic impacts are regional impacts, not just for the selected county.
Download the Monetary Impacts data: 2021 RWP - Socioeconomic Impact Analysis - Regional Economic Impacts
Download the Social Impacts data: 2021 RWP - Socioeconomic Impact Analysis - Regional Social Impacts
Navigate to the TWDB Planning Data Homepage
Socioeconomic Impact Analysis for the 2021 Regional Water Plans
Note: projected socioeconomic impacts are regional impacts, not just for the county of interest.
- (A) Panhandle
- (B) Region B
- (C) Region C
- (D) Region D
- (E) Far West Texas
- (F) Region F
- (G) Brazos G
- (H) Region H
- (I) East Texas
- (J) Plateau
- (K) Lower Colorado
- (L) South Central Texas
- (M) Rio Grande
- (N) Coastal Bend
- (O) Llano Estacado
- (P) Lavaca
Navigate to the TWDB Planning Data Homepage
Socioeconomic Impact Analysis for previous Regional Water Plans
2016 Regional Water Plans Socioeconomic Impacts of Water Needs
- (A) Panhandle
- (B) Region B
- (C) Region C
- (D) Region D
- (E) Far West Texas
- (F) Region F
- (G) Brazos G
- (H) Region H
- (I) East Texas
- (J) Plateau
- (K) Lower Colorado
- (L) South Central Texas
- (M) Rio Grande
- (N) Coastal Bend
- (O) Llano Estacado
- (P) Lavaca
2011 Regional Water Plans Socioeconomic Impacts of Water Needs
- (A) Panhandle
- (B) Region B
- (C) Region C
- (D) Region D
- (E) Far West Texas
- (F) Region F
- (G) Brazos G
- (H) Region H
- (I) East Texas
- (J) Plateau
- (K) Lower Colorado
- (L) South Central Texas
- (M) Rio Grande
- (N) Coastal Bend
- (O) Llano Estacado
- (P) Lavaca
2006 Regional Water Plans Socioeconomic Impacts of Water Needs
- (A) Panhandle
- (B) Region B
- (C) Region C
- (D) Region D
- (E) Far West Texas
- (F) Region F
- (G) Brazos G
- (H) Region H
- (I) East Texas
- (J) Plateau
- (K) Lower Colorado
- (L) South Central Texas
- (M) Rio Grande
- (N) Coastal Bend
- (O) Llano Estacado
- (P) Lavaca
Navigate to the TWDB Planning Data Homepage
For questions, please contact the Projections and Socioeconomic Analysis Department at EDA@twdb.texas.gov or navigate to the Water Supply Planning Staff
Navigate to the TWDB Planning Data Homepage
Methodology Documents
- Quick Overview of the Socioeconomic Impact Analysis
- Detailed Methodology for the 2021 Socioeconomic Impact Analysis
- Socioeconomic Dashboards User Guide
Frequently Asked Questions
Note: References to Impact Analysis within this set of FAQ questions and responses refer to the Texas Water Development Board (TWDB) Socioeconomic Impact Analysis.
Users are encouraged to use the search tool (ctrl F) associated with their web browser or pdf reader to locate the questions related to their topic of interest or a facet of the analysis requiring additional explanation.
Questions may be submitted to the Projections and Socioeconomic Analysis staff at: EDA@twdb.texas.gov
Acronyms
- ERCOT: Electrical Reliability Council of Texas
- IMPLAN: Impact Planning Model
- NAICS: North American Industry Classification System
- RWP: Regional Water Plan
- RWPA: Regional Water Planning Area
- RWPG: Regional Water Planning Group
- SWP: State Water Plan
- TAMU Agri-life: Texas A&M University, Agri-Life Extension Service
- TCEQ: Texas Commission on Environmental Quality
- TML: Texas Municipal League
- TxGIO: Texas Geographic Information Office
- TWDB: Texas Water Development Board
- USDA: United States Department of Agriculture
- WUG: Water User Group
- WUS: Water Use Survey
Click on the Question to see the Answer
- What is the purpose and scope of the Impact Analysis?
- What impact measures are included in the Impact Analysis?
- What are major facets of economic impacts not addressed by the Impact Assessment?
- What is IMPLAN, and what role did it play in the Impact Analysis?
- What data sources provided the water use values used in the Impact Analysis?
- What were the primary datasets incorporated into the Impact Assessment?
- What were the key data sources used in the Socioeconomic Impact Analysis?
- What was the general approach for determining the initial estimates of the value of water in the major water use categories?
- How were the initial IMPLAN sector level value of water estimates adjusted to account for differences in firms involved in the Water Use Survey (WUS) and the IMPLAN data?
- How were adverse economic impacts phased in for varying degrees of water shortages?
- What water uses were considered to be water-intensive within the municipal-commercial water use category?
- How were the final impact estimates for income, job, and tax losses determined?
- Impact estimates for the irrigated agriculture sector relied upon IMPLAN data, yet employed a slightly different portion of that output to obtain the final impacts. What was the difference in approach, and what prompted that alteration in methodology?
- An alternative income measure (non-IMPLAN based) was employed for the steam-electric power generation water use category. Why was the different methodology necessary, and how was the measure calculated?
- What area of geographic influence is accounted for in the Impact Analysis, and are spillover impacts to other planning regions considered?
- What is consumer surplus, and how is it used in the Impact Analysis?
- Are impacts in the forward linked sectors for a drought impacted production sector also considered in the Impact Analysis?
- Several factors caused differences in impact estimates when comparing results from the 2016 RWPs with the more recent 2021 RWPs. Updates of the relevant data, changes in impact assessment methodology, and the revision of needs all contributed to such impact estimate differences. How did those factors specifically contribute to changes in the lost income impact estimates when examining the state level impacts?
- Why were projected demands in the manufacturing water use category markedly smaller in the 2021 RWPs versus the 2016 RWPs, and why, despite the decreased demands, were projected impacts larger in the 2021 RWP?
- Why do some counties and water use categories have a water supply need, yet no economic impact?
- Why do impact estimates possibly differ for counties with similar volume of needs?
- How were utility revenue losses calculated?
- Projected water needs for the state under drought of record conditions more than double from 2020 to 2070, increasing from 3.1 million acre-feet to nearly 6.8 million acre-feet. The associated expected income losses (value added) increase by approximately 39% (from 98 to 136 billion dollars). Why the disparity in the magnitude of the impacts, with needs more than doubling but lost income impacts increasing by a smaller percentage amount?
- Why are the final impact estimates considered to be conservative?
- What outside and internal peer reviews aided in alterations for the methodologies and/or reporting format used in the 2021 RWPs?
- Should lost consumer surplus estimates from the residential water use impact measures be added to other monetary impact measures to obtain a total monetary impact?
- How were water hauling costs estimated?
- Why was the degree of shortage of 80% selected as the tipping point for impact measurement to switch from lost consumer surplus to trucking costs?
- Should regional level monetary impacts be summed across all regions to determine a state level impact estimate?
- Should impact estimates for regional total lost income for all WUGs be used as an estimate of the potential benefits of a water management strategy which mitigates all or a portion of an anticipated need?
Answers to Socioeconomic Impact Analysis Questions
1. What is the purpose and scope of the Impact Analysis?
The analysis provides impact estimates for ten possible impact measures for each decade in which needs (shortages) are projected to occur for Water User Groups (WUGS) within the regional water plan planning process. Impact estimates are developed to provide a measure of the impact of a single year repeat of the drought of record if no water management strategies are implemented to offset the projected needs.
2. What impact measures are included in the Impact Analysis?
Ten measures, within three major categories, are estimated for the Regional Water Plan (RWP) Impact Analysis.
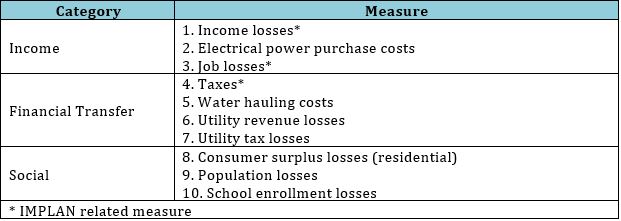
The primary measures of interest are the income and job loss estimates (measures 1 and 3). Three of the measures, marked with an asterisk (*), rely heavily on output from a Regional Water Planning Area (RWPA) specific IMPLAN model.
3. What are major facets of economic impacts not addressed by the Impact Assessment?
The Impact Assessment attempts to determine estimates of lost income and jobs (among other measures) to the planning region accompanying a one-year repeat of the drought of record. The analysis does not attempt to address the more specific tasks below:
- Perform a benefit-cost analysis of potential mitigation strategies,
- Explore the impacts of building moratoriums for cities with limited water supplies, nor
- Reflect impacts in the forward linked sectors.
Benefit-cost analyses require extensive cost and benefit estimation efforts (across numerous time periods). Similar efforts to estimate the impact of a building moratorium, coupled with the possible lifting of the moratorium, also require a complex effort with multiple assumptions concerning both the timing and magnitude of positive and negative impacts. The Impact Analysis does provide baseline data which might be used in such efforts, but the listed tasks would require a great deal more effort and a large array of key assumptions, especially when considering the fifty year time horizon, complexity of the various regional economies, continuing growth of regional populations, and approximately 2,800 individual WUGs within the 16 RWPAs. Building moratorium impacts as well as consideration of impacts in forwardly linked sectors (downstream in the production process) were also deemed too complex for the analysis context of the Impact Analysis.
4. What is IMPLAN, and what role did it play in the Impact Analysis?
IMPLAN, or the Impact Planning Model, is an economic impact assessment software system, originally developed by the U.S. Forest Service, and now maintained by the Minnesota IMPLAN Group (MIG, IMPLAN.com). IMPLAN reflects economic activity in 536 sectors, and detailed economic data for all 254 counties within the state for the year 2016 was used to develop 16 different regional planning area-based impact assessment models. IMPLAN output related to value-added, job losses and taxes (on production and imports) was used as baseline data within the Impact Analysis. Value-added is the dollar value of total production within an economic sector minus all costs of producing that output.
In addition, IMPLAN output allows converting initial estimates of impacts (value-added, jobs, taxes) to regional level impact estimates reflecting additional impacts within the economy. Note that value-added estimates from IMPLAN serve as the basis for the income estimates. Three types of effects may be incorporated into the final regional level impact estimates:
- Direct effects representing the initial change in the industry analyzed;
- Indirect effects that are changes in inter-industry transactions as supplying industries respond to reduced demands from the directly affected industries; and,
- Induced effects that reflect changes in local spending that result from reduced household income among employees in the directly and indirectly affected industry sectors.
Total estimates are calculated using IMPLAN based multipliers to adjust the baseline estimates of value-added, jobs, and taxes to their regional level impact estimates. Water use categories for which IMPLAN data was employed include livestock, mining, manufacturing, irrigated agriculture, and commercial: water-intensive.
5. What data sources provided the water use values used in the Impact Analysis?
Three key data sources were utilized for the baseline water use data:
- The TWDB annual Water Use Survey (WUS) estimates,
- The TWDB Water Science and Conservation (WSC) annual irrigation water use estimates, plus
- TWDB-Economic and Demographic Analysis staff estimates of annual livestock, mining, and steam electric water use.
Combining the three sources resulted in estimates for 6 major water use categories:
- Livestock,
- Irrigated Agriculture,
- Steam Electric Power,
- Mining,
- Manufacturing, and
- Municipal
Summary results for the three combined efforts (by year) are available at the website: Water Use Survey
Year 2016 estimates from data sources 1 and 3 above were employed when determining the value of water for the categories not related to irrigated agriculture. Water use for five years (2012-2016) was used in determining the value of water in irrigated agriculture. The five-year average impacts were utilized in the irrigated agriculture sector to account for the greater variability in water use and economic conditions within that water use category.
6. What were the primary datasets incorporated into the Impact Assessment?
- IMPLAN data and models (IMPLAN, 2016),
- 2016 water use estimates,
- RWP projected water demands and needs (2021 RWP),
- residential / commercial water use and prices (TML, 2016), demand function and lost consumer surplus and lost utility revenue estimates,
- commercial water use and prices (TML, 2016) lost utility revenue estimates,
- 2012-2016 agriculture product prices, yields, water use and acreages (NASS),
- kWh/acre-foot estimates by county for steam electric power generation (EIA, 2016),
- number of firms data (U.S. Census Bureau, County Business Patterns, 2016),
- miscellaneous gross receipts tax rate (Office of the Texas Comptroller of Public Accounts, 2018),
- kindergarten through high school proportion of total population (2016, Texas Demographic Center).
7. What were the key data sources used in the Socioeconomic Impact Analysis?
Over thirty different sources of data were employed in developing the impact estimates for each of the 16 different planning region assessments and ten impact measures. Key sources, grouped by data type or water use category, appear in the table below.

8. What was the general approach for determining the initial estimates of the value of water in the major water use categories?
In general, the analysis employed initial estimates of the total effects (the sum of direct, indirect, and induced effects) divided by the associated water use. When calculated for the income loss measure, the measure provides a $/acre-foot estimate of the value of potentially lost income for each acre-foot of water not available to the WUG of interest. This step was performed for each relevant IMPLAN sector within each TWDB water use category. Year 2017 NAICS codes were used to link the IMPLAN sectors to the appropriate TWDB water use category, and the results were aggregated to reflect the total income lost estimates for the category. Similar calculations were performed for the job and tax loss estimates, resulting in initial estimates of the number of jobs, or dollar estimate of taxes potentially lost for each acre-foot of shortage within the IMPLAN sector.
9. How were the initial IMPLAN sector level value of water estimates adjusted to account for differences in firms involved in the Water Use Survey (WUS) and the IMPLAN data?
Differences in the number of firm adjustments were required for lost income estimates in the mining and manufacturing water use categories. The TWDB Water Use Survey (WUS) focuses on the larger water users in the state/region, and reflects only a portion of the firms reflected in the IMPLAN estimates of income, jobs, and taxes. Use of the unadjusted initial estimate of lost income/acre-foot of water used proved to be inflated due the inclusion of all income generated in the sector being divided by only a portion of the water used to generate that income. Initial regional value-added (income) per acre-foot estimates were therefore adjusted downward using the ratio of the number of firms with 50 or more employees versus the total number of employees in the sector. This adjustment generated a more accurate estimate of the value of water, and similar adjustments were applied to the initial estimates of jobs/acre-foot and taxes/acre-foot.
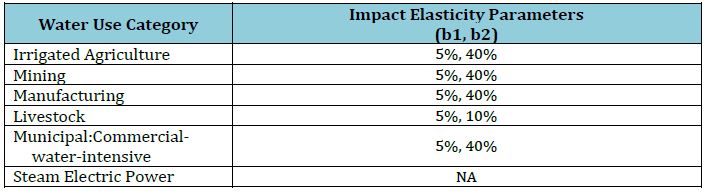
10. How were adverse economic impacts phased in for varying degrees of water shortages?
Additional adjustments, varying with the intensity of the drought, were applied to the lost income/acre-foot estimates, as well as the lost jobs and tax measures. An impact elasticity function was used to phase in the degree of damage based upon the initial impact/acre-foot and the degree of water shortage. Water users were assumed to have a degree of flexibility in managing water use for small shortages. The figure below depicts a sample impact elasticity function where no damages are assumed to accrue for all shortages below a lower threshold (say a 5% shortage), and subsequent damage estimates/acre-foot increase linearly up to the initial estimate of lost income/acre-foot ($1,000/acre-foot in the figure). A second threshold (40% in the figure) serves as the level of shortage for which all damages are assigned the baseline lost income/acre-foot value. Lost income values for percent needs between the two thresholds were obtained by linear interpolation between zero and the baseline income/acre-foot estimate (i.e., $1,000/acre-foot in the figure).
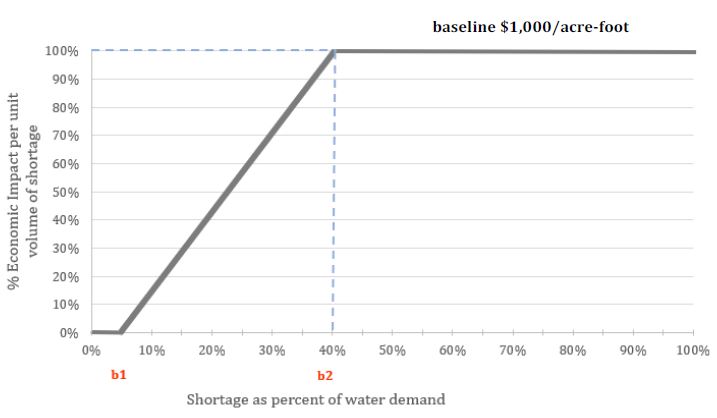
Lower and upper thresholds (b1 and b2, respectively) were specified for each water use category as shown below, and this methodology was used for the final impact estimates for lost income, jobs, and taxes. Note that the impact elasticity methodology was not used for the steam electric power water use category. Supplemental power purchases from the electric power grid would have to be made at the full expected price of electricity, with no phase-in of adverse impacts.
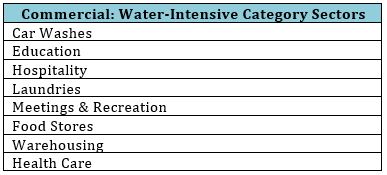
11. What water uses were considered to be water-intensive within the municipal-commercial water use category?
Eight general categories were considered to be water-intensive as shown in the table below. These sectors were included in the water-intensive classification based on the value of water and their susceptibility to larger drought induced adverse impacts. Estimates of the lost income, jobs, and taxes were made for each of the eight sectors listed and appear as an aggregated total within the impact estimates.
12. How were the final impact estimates for income, job, and tax losses determined?
As noted in earlier FAQ responses, the initial regional level impact estimates for lost income, jobs, and taxes were possibly adjusted for the number of firms (i.e., within the mining and manufacturing water use categories), and were also adjusted for the degree of water shortage within the water use category. These calculations were made for each IMPLAN sector in the water use category within each county. Values/acre-foot were multiplied by the number of acre-feet short and summed across all IMPLAN sectors in the water use category for each county or WUG. This process implicitly takes into account the proportion of water used in each IMPLAN sector. The resulting impact estimates therefore reflected the variability of economic activity within each WUG. For example, a county with large mining water use for oil and gas exploration would have a higher impact estimate than one which focused on the less profitable sand and gravel quarrying, even if the two counties had the same degree of water shortage.
13. Impact estimates for the irrigated agriculture sector relied upon IMPLAN data, yet employed a slightly different portion of that output to obtain the final impacts. What was the difference in approach, and what prompted that alteration in methodology?
IMPLAN output for value-added for the irrigated agriculture IMPLAN sectors included the value of both irrigated and dryland production within each county/region. Direct use of the IMPLAN estimates of value-added would therefore have overstated the value of water in the sector. An alternative approach was used where estimates of the total output in dollars (crop yield*price*acres) was calculated for the appropriate crops using data from non-IMPLAN sources. A second type of multiplier, available from IMPLAN, was then used to convert the total output ($) estimates by crop and county to the regional level estimates of income. Similar multipliers were also available to convert total output to the regional level estimates of jobs. Taxes were not considered in this water use category due to the presence of government subsidies. The resulting estimates of lost income and jobs per acre-foot were then used in the analysis. One additional alteration was employed. Variability in water use, weather, and economics in the irrigated agriculture category prompted use of the five year average total output/acre-foot of use to determine the initial value of water per acre-foot. Total output data for the years 2012-2016 was used in developing these values, and adjustments for the degree of water shortage and the aggregation techniques described in earlier FAQ responses were used in determining the final impact estimates for the irrigated agriculture water use category.
14. An alternative income measure (non-IMPLAN based) was employed for the steam-electric power generation water use category. Why was the different methodology necessary, and how was the measure calculated?
The steam electric power generation category is very dissimilar to the other categories considered. In general, without enough cooling water, utilities would have to throttle back plant operations, possibly forcing them to buy costly power from other providers or to generate higher cost power at other plants under their control in order to meet customer demands. Direct use of the value-added estimates from IMPLAN was deemed less indicative of the damages incurred due to a drought, and the income measure used was the expected cost of power purchased using the day-ahead market price within Texas. Average day-ahead prices for the heavy drought year 2011 were used as proxy values for the cost of the purchases, and year 2016 average kWh/acre-foot of water estimates (by county) were used to determine the amount of electricity needed to be purchased for the acre-feet of needs in each county. The final cost for each need was determined as the product of the electrical price/kWh and the estimated kWh associated with the acre-feet of needs. No impact elasticity functions were employed for this water use category.
15. What area of geographic influence is accounted for in the Impact Analysis, and are spillover impacts to other planning regions considered?
Water needs are estimated at the WUG-level, by region, for municipal water uses and at the county-level for the remaining water use categories. Regional level multipliers from IMPLAN were used to adjust the initial estimates of income, jobs, and taxes to reflect impacts on other sectors in the planning region only. Potential spillover effects to other planning regions do exist, but are not accounted for in the Impact Analysis. The Impact Analysis assumes that the drought occurs in Region X only. Backward linkages to input sectors in other regions are not accounted for. Similarly, forward linkages to relevant sectors which use Region X outputs are also not accounted for.
16. What is consumer surplus, and how is it used in the Impact Analysis?
Consumer surplus is a welfare economics measure of well-being, and is a useful tool to assess the damages or benefits accruing to consumers when economic or resource availability conditions change. In the context of a drought, reduced water supplies adversely affect consumers as they cannot consume as much water as they desire, and lost consumer surplus is a measure of how much homeowners would be willing to spend to be able to consume water at those normal levels of use.
Impact analysis estimates of lost consumer surplus were made using household level, municipal WUG specific, water demand functions (both outdoor and indoor water use) based on average price and quantity of water used data from the Texas Municipal League annual survey data effort (year 2016). These estimates varied with the degree of shortage, up to shortages of 80%. Consumer surplus estimates for shortages greater than that value were not estimated, primarily due to estimation issues associated with the demand functions for very small quantities of water.
17. Are impacts in the forward linked sectors for a drought impacted production sector also considered in the Impact Analysis?
Traditional use of input-output analysis via IMPLAN only captures impacts on backwardly linked sectors (i.e., wheat sales as an input to pasta production). Potential adverse impacts in the forward linked sectors, such as the reduced retail beef sales accompanying fewer marketable cattle following a drought, are not accounted for in the Impact Analysis. This is a shortcoming of the current approach, and is a facet which the IMPLAN model is not readily suited for, especially when dealing with numerous impacted sectors and 254 counties.
18. Several factors caused differences in impact estimates when comparing results from the 2016 RWPs with the more recent 2021 RWPs. Updates of the relevant data, changes in impact assessment methodology, and the revision of needs all contributed to such impact estimate differences. How did those factors specifically contribute to changes in the lost income impact estimates when examining the state level impacts?
The table below depicts the general trends across decades for the magnitude and direction of changes for the income impact estimates when comparing the 2021 state totals vs the 2016 state totals. The magnitude of change is shown by the relative size of the arrows (small (<5%), medium (5 to 25%), and large (>25%)), and the direction and color of the arrow indicating whether a particular measure increased or decreased when comparing impact estimates for the 2021 RWPs versus similar impact estimates from the 2016 RWPs. Values shown are for the state as a whole using the sum of all the regional water plan estimates, with similar tables being possible for each planning region. Trend indicators are shown for one change factor (needs) and two possible analysis responses (lost income, and lost income/acre-foot of need).
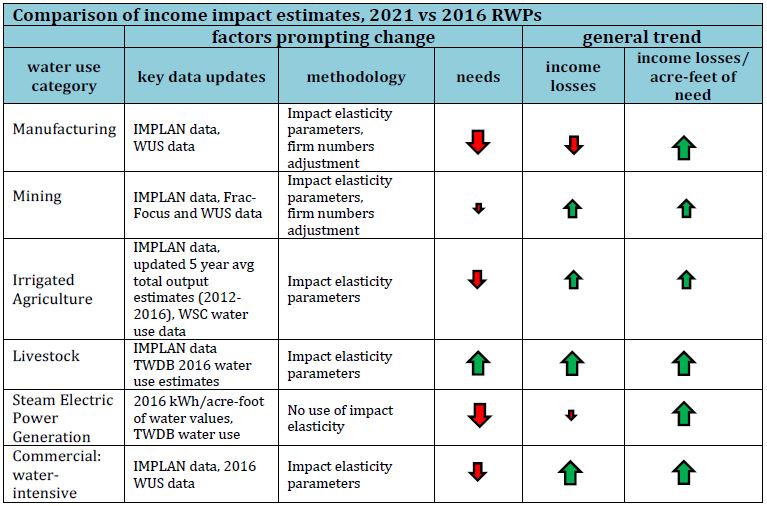
Projected needs are smaller in five of the six categories shown, increasing only in the livestock sector. The accompanying income loss estimates increase in magnitude in four of the six water use categories, with small to medium declines in the overall projected income losses in the manufacturing and steam electric water use categories. The productive value of water, and the accompanying increase in adverse income losses, continues to increase over time as evidenced by the medium to large increases in the income losses/acre-foot of need shown in all six water use categories.
Note that the trends depicted in the figure above could likely vary significantly if portrayed for an individual planning region. Regional level trends may be masked when combined with other regional data and results shown at the state level. The magnitude, and possibly even direction, of a given trend indicator (arrow) might change due to differences in economic conditions or water use projections within the region of interest, for a given water use category, when compared to the state level results shown in the original figure.
19. Why were projected demands in the manufacturing water use category markedly smaller in the 2021 RWPs versus the 2016 RWPs, and why, despite the decreased demands, were projected impacts larger in the 2021 RWP?
State totals reported for manufacturing water use have been on the decline in recent years, yet the value of output per acre-foot of water use has increased. Water use efficiency has increased. In the interest of providing conservative water use projections, year 2030 manufacturing water use projections were assumed to remain constant throughout the remainder of the planning horizon, despite recent downward trends in total use. The increases in water use efficiency, coupled with the increase in value of the water, outpaced the decreases in demands and subsequent needs, resulting in larger impacts in the 2021 RWP.
For more information regarding the projection methodology for manufacturing, please visit: Projections Methodology
20. Why do some counties and water use categories have a water supply need, yet no economic impact?
Positive needs may exist for a given decade, yet use of the impact elasticity functions may result in no estimated economic damages. For example, if water shortages are less than 5%, the Impact Analysis assumes there is enough flexibility in the water supply system or production unit to result in no damage assessment.
21. Why do impact estimates possibly differ for counties with similar volume of needs?
The variety of goods and services produced varies from one county to another, and the procedures used for determining the impact estimates reflect that variability as well as the differing value of water in various economic sectors and water use categories. For example, counties with large irrigated agricultural production will have smaller adverse impact estimates when compared to counties with a similar degree of need in manufacturing due to the higher value of water within manufacturing.
22. How were utility revenue losses calculated?
Year 2016 data from the Texas Municipal League (TML) annual survey concerning average monthly water prices paid and quantity used was employed to estimate lost utility revenue for both residential and commercial use. Price data is available for both residential and commercial use, and average prices from the TML data were multiplied by the acre-feet of needs to estimate the value of lost utility sales. The TML data for various years, including the year 2016 values, is available at the TML Survey Results Website
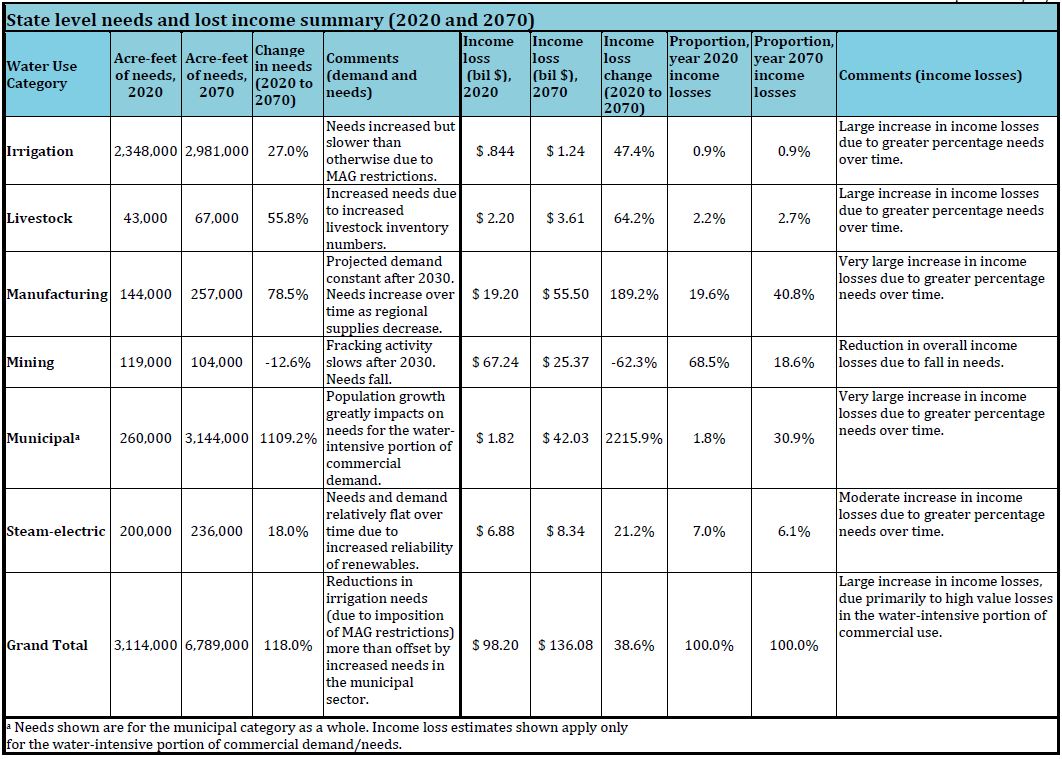
23. Projected water needs for the state under drought of record conditions more than double from 2020 to 2070, increasing from 3.1 million acre-feet to nearly 6.8 million acre-feet. The associated expected income losses (value added) increase by approximately 39% (from 98 to 136 billion dollars). Why the disparity in the magnitude of the impacts, with needs more than doubling but lost income impacts increasing by a smaller percentage amount?
Lost income effects vary markedly by water use category. When viewed at the state level with all six water use types combined, however, the presence of a large quantity of lower valued water (associated with nearly 3 million acre-feet of needs for the irrigated agriculture sector) dampens the overall possible lost income for the state. A doubling of needs by the year 2070, with a large proportion of lower valued water associated with irrigated agriculture, is not sufficient to double the lost income estimate from the initial year 2020 estimate for the state as a whole.
Individual factors which influence the final lost income impact estimates include the following:
- Trends in water demands implicit within the demand projections: (i.e., fracking water use within mining is expected to decline in the later decades of the planning period, while increases in water use efficiency are expected to dampen demands in future decades for the manufacturing category). Both the timing and projected demand amounts influence the final income loss estimates. Additional detail on development of the water demand projections appear in the PDFs below:
- Greater income losses due to increased degree of shortages: (i.e., lost income impact estimates (per acre-foot of need) increase as the degree of shortage increases within each WUG, resulting in higher overall lost income impacts as the degree of drought worsens). Impact elasticity functions are used to phase in larger lost income impacts as the degree of drought worsens. Additional details appear in the impact estimate methodology description: Detailed Methodology for the 2021 Socioeconomic Impact Analysis
- The underlying value of water within each water use category, and the relative proportion of needs within each water use category: total lost income impacts for the state will vary with the composition of the impacts for each of the water use categories. For example, large population growth in the municipal sector, including the increase in needs for the water-intensive commercial subportion of municipal use, resulted in very large increases in lost income for that category, especially as the degree of shortage increases over time. As seen in the table below, the income losses for this subportion of municipal use grew from approximately 2% in 2020 to nearly 32% of projected income losses in 2070.
Additional detail concerning the trends in needs and lost income for each water use category (for the period 2020 to 2070) and the state as a whole appear within the following table.
24. Why are the final impact estimates considered to be conservative?
Impact estimates within the analysis are likely conservative (too small) for several reasons, with a partial list appearing below:
- The analysis focuses on those sectors with adequate water use data;
- consideration of only 1 year of drought;
- no consideration of impacts on the forwardly linked sectors (both within the region of interest as well as impacts on adjoining regions);
- no consideration of backward linked impacts on other planning regions;
- does not consider the possible impacts of building moratoriums for those WUGs with significant long term water shortages; and
- a lack of considering the increasing scarcity of water throughout the region, and the resulting impact on the use of technology, on the true value of water.
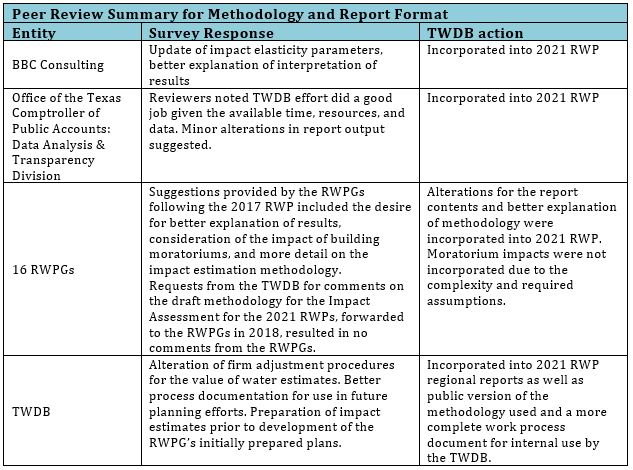
25. What outside and internal peer reviews aided in alterations for the methodologies and/or reporting format used in the 2021 RWPs?
Following completion of the 2017 State Water Plan, three major entities were consulted concerning potential improvement in the methodology and reports associated with the Impact Analysis. In addition, details of the draft methodology for the 2021 RWPs were sent to the RWPGs in 2018 for review. Results of those efforts, coupled with an internal review by TWDB personnel, appear below.
26. Should lost consumer surplus estimates from the residential water use impact measures be added to other monetary impact measures to obtain a total monetary impact?
Lost consumer surplus is not an out-of-pocket cost or foregone income measure similar to the lost income estimated for the remaining water use categories. Although lost consumer surplus values are estimated monetary losses, they are a different type of monetary impact, and ideally should not be added to other monetary estimates of loss.
27. How were water hauling costs estimated?
Sample potable water hauling costs (trip lengths of 30 to 60 miles one way) from several locations within the state provided a baseline value of $35,000/acre-foot. These costs could vary significantly depending on the length of trip and the source of the trucked in water. All shortages exceeding the 80% acre-foot level of the projected demand were assumed to be trucked to the WUG to meet minimum sanitary and consumptive needs.
28. Why was the degree of shortage of 80% selected as the tipping point for impact measurement to switch from lost consumer surplus to trucking costs?
This threshold was chosen since it approximates general minimum daily use values required to meet daily human consumption and sanitary needs. Water for shortages exceeding the 80% threshold is assumed to have to be trucked in at significant cost. The specific minimum use percentage for human basic needs will vary by city, depending on how efficient the populace is at conserving water (i.e., how low the baseline average GPCD (gallons/person/day) values are for the city). A second factor prompting the switch was the reduced reliability of the underlying indoor demand functions when estimating lost consumer surplus for large degrees of shortage. The demand functions employed become very steep (primarily due to the underlying mathematical functional form used) as one approaches small levels of water use, and experience has shown that estimates of lost consumer surplus are not reliable in such instances.
29. Should regional level monetary impacts be summed across all regions to determine a state level impact estimate?
Aggregation of the results across some or all planning regions will result in an underestimate of the impacts, primarily due to regional level IMPLAN models not taking into account spillover impacts to counties and regions not included in the parent impact model for the region. In practice, however, results are often summed. Users of the results should take note of the potential underestimation concern, and inform their intended audience of that point. The degree of underestimation is not easily quantified due to the many complex points of interaction among the multiple flows of inputs and outputs across planning regions.
30. Should impact estimates for regional total lost income for all WUGs be used as an estimate of the potential benefits of a water management strategy which mitigates all or a portion of an anticipated need?
The temptation in this setting is to divide the estimate of regional total lost income by the acre-feet of needs used to derive that lost income estimate, and then multiply by the acre-feet of needs mitigated by the proposed water management strategy. Regional total lost income estimates should not be used in this context as a means of determining the possible benefits of implementing a particular water management strategy. Several major reasons apply:
- The regional total lost income estimates will include a composite impact, combining the various degrees of shortages and values of water for each of the WUGS and water use categories used to determine the regional total lost income estimate,
- The underlying needs (percent shortage) used in estimating the RWP impact estimate will likely not correspond to the degree of shortage mitigated by the proposed water management strategy. The impact estimates vary with the degree of shortage of individual WUG and with water use category,
- The proposed water management strategy may not address the needs in a single water use category, complicating assignment of the possible benefits to each category.
Individual water management strategies would likely offset needs in several WUGS and within several water use categories. Matching the specific needs of mitigation to the appropriate WUG and type of need, and then to the appropriate impact values, would likely be a daunting task.
Navigate to the TWDB Planning Data Homepage